
Analytics
This section shows how many messages were sent, how many of them got through and how much it cost.
Open the app → Analytics.
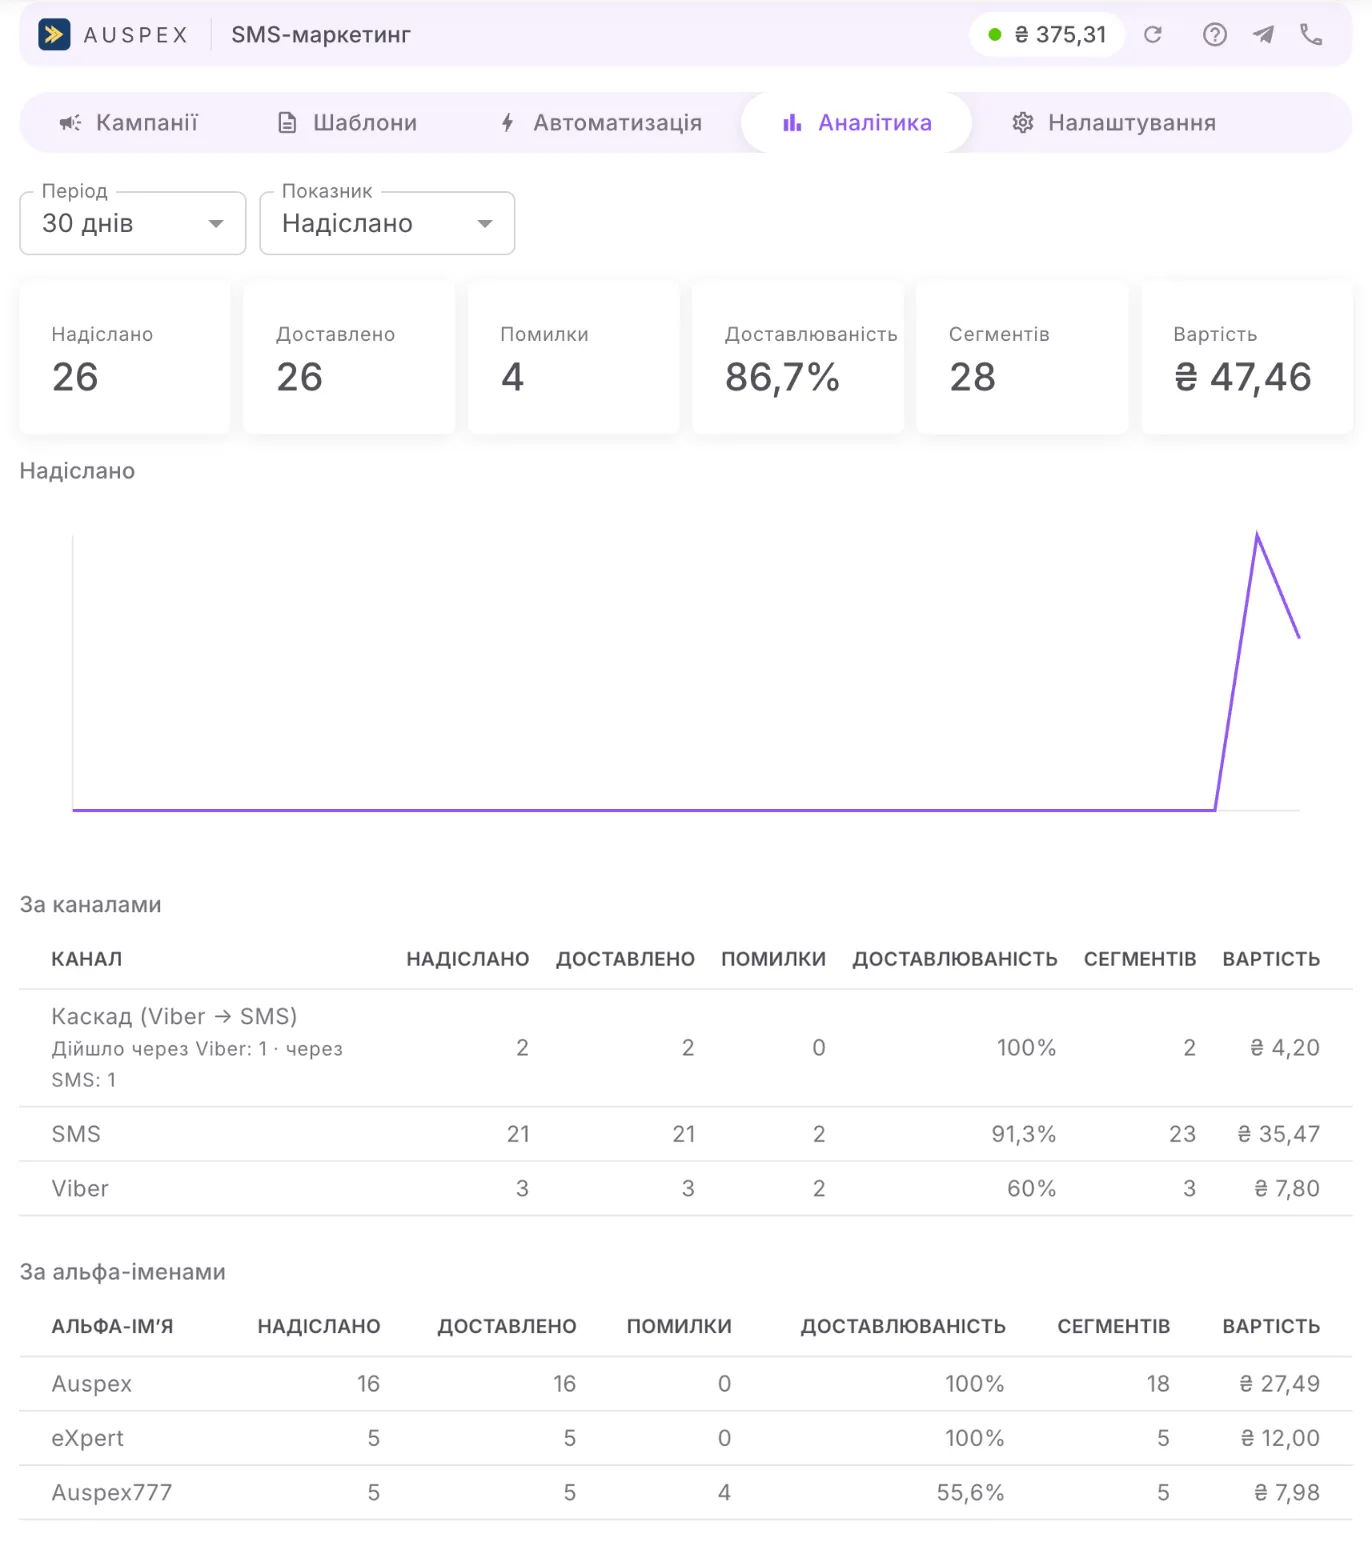
Metrics
Section titled “Metrics”| Metric | What it means |
|---|---|
| Sent | messages that AlphaSMS accepted for sending |
| Delivered | the operator confirmed delivery to the phone |
| Failed | messages that were not delivered or were rejected |
| Delivery rate | the share of delivered messages among those that already have a final response |
| Segments | how many SMS segments were paid for (a long message is several segments) |
| Cost | how much was charged for the messages sent |
Messages rejected straight away (for example, a number on the stop list or a wrong format) are not counted in “Sent”, and no money is charged for them.
Period and chart
Section titled “Period and chart”- Period — 7, 30 or 90 days.
- Metric — what to show on the chart by day.
Days are counted in the time zone from Settings. All of the portal’s messages are counted: from the card, from campaigns and automatic ones.
By channel and by alpha name
Section titled “By channel and by alpha name”Below the chart there are two tables for the same period, with the same metrics as the cards:
- By channel — SMS, Viber and cascade separately. The cascade row shows how many messages got through via Viber and how many via SMS.
- By alpha name — a separate row for each sender name. If the portal sends messages for several brands, this shows how much each one sent and spent. A cascade message is counted for the name it was delivered from; until it is delivered, for the Viber name.
A table appears as soon as the period has at least one message.
Why the figures change
Section titled “Why the figures change”A delivery report from the operator does not arrive instantly: it takes anywhere from seconds to several days if the customer’s phone is switched off. So today’s message is first counted as sent and becomes delivered later. The data is refreshed about once every five minutes; the “data is updating” label means the recalculation is still in progress.
Delivery for an individual campaign is shown right in its row in the Campaigns list.