
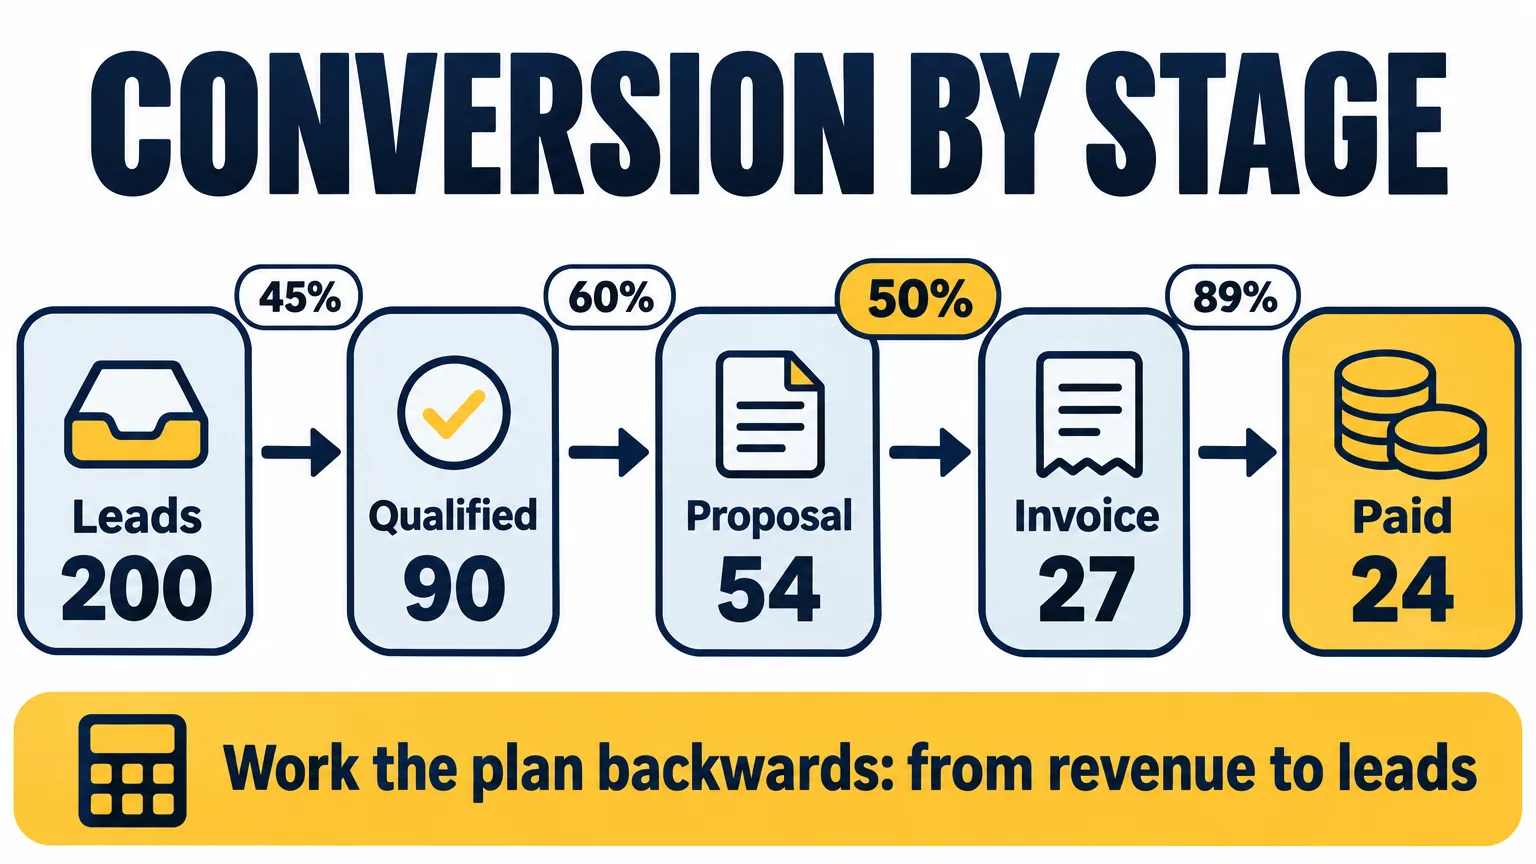
The sales conversion formula for each stage
The formula is the same for any transition: stage conversion equals the number of deals that moved to the next stage, divided by the number of deals that were in this stage, times 100%. Overall conversion from lead to payment is the product of the conversion rates of all transitions. Below is an illustrative five-stage pipeline over one quarter; the stages are the same as in the article on entry conditions.
- New inquiry: 200 deals.
- Qualified: 90 deals, 45% conversion.
- Proposal sent: 54 deals, 60%.
- Invoice issued: 27 deals, 50%.
- Paid: 24 deals, 89%.
Overall conversion is 24 ÷ 200 = 12%. On its own it says little: you get 12% both when qualification filters out the wrong leads and when reps cannot keep up with sending proposals. The stages show that in this example half the deals stop between the proposal and the invoice, and that is where to open ten lost deals and read them one by one.
You can trust these percentages only if each stage has an entry condition: the quote has been sent, the invoice has been issued, the money has arrived. When a rep moves a deal to "Proposal sent" after the first call, conversion measures the rep's mood. How to write entry conditions is covered in the article on sales pipeline stages.
Period or cohort: why one pipeline gives two numbers
The most common way to calculate it is to divide November's payments by November's leads. It is quick, but it mixes different deals. If the sales cycle takes six weeks, November's payments grew out of September and October leads, while November's leads are still in progress. A month when ads brought twice as many leads will show a drop in conversion even though the team sold just as well.
The second way is a cohort: take all the leads from September and see how many of them reached each stage by the end of November. RevSure advises reading a cohort no earlier than one sales cycle later, otherwise deals still in progress look like losses. Systemno, in its breakdown of B2B services, also counts by cohort: contacts from March and what became of them by June. For sales with a cycle longer than a month, this is the more reliable way.
Both methods work as long as you do not mix them. Next to every conversion figure, write down how it was calculated: "September leads, status as of 30 November" or "November payments and leads".
Where to get the numbers: the funnel conversion report in your CRM
You do not have to calculate by hand: most CRMs have a funnel conversion report. Each system calculates it by its own rules, and you need to know them before comparing months.
- Uspacy. You create the Funnel conversion report under Analytics → Reports and widgets → Create, with the funnel chart type. For each stage it shows the number of deals, the number that skipped the stage, the average time in the stage, conversion from the previous stage and cumulative conversion from the start of the funnel. Conversion can exceed 100% when deals are created directly at a later stage.
- Pipedrive. By default, the Funnel conversion report takes deals created this year that are already closed as won or lost. A won deal is treated as having passed every stage, even if it was closed from the middle of the pipeline. Open deals are left out of the figure.
- HubSpot. The funnel report builds stages from automatic "date entered stage" timestamps, and the date range filter works by the date of the event: a deal created six months ago will appear in the report for the last 90 days if it went through the stages in those 90 days.
The same pipeline in three systems will give three different percentages, and none of them is wrong. The Skipped column in Uspacy doubles as a data check: if half the deals jump over the Invoice stage, conversion on the neighboring transitions no longer describes selling but how reps keep their deal records.
What counts as a normal sales conversion rate
There is no benchmark you can take from the internet and lay over your own pipeline. The Norwest 2025 survey covered 177 sales and marketing leaders at VC- and PE-backed B2B companies. The medians are about 36% from lead to sales-qualified lead, 40% from qualified lead to opportunity, 42% from opportunity to proposal and 45% from proposal to win. But for every transition the answers spread from "1–10%" to "91–100%", and the companies in the survey are larger and built differently from a business of 10–200 people.
The second reason for the spread is the denominator. Ivristech collected published B2B win rates: from 21% to 47%. RAIN Group's 47% is counted against deals that reached a proposal, HubSpot's 21% against all opportunities, and that is 2023 data. The same 180 won deals come out as 18% or 47% depending on which deals sit in the denominator.
So your working benchmark is your own conversion over past periods, calculated the same way and across the same stages. RevSure suggests putting the four previous quarterly cohorts side by side: your own history uses your own stage definitions. Compare a month with your own past, and reps with one another within one pipeline. An outside figure is useful as a starting point for a question: in the illustrative example above, 44% of proposals turn into payments, the Norwest median from proposal to win is 45%, and the two can be compared only if your "Proposal sent" means the same as their "proposal".
How to calculate a sales plan from conversion: an example
Stage conversion rates let you check a sales plan before it is announced to the team. You calculate backwards, from the amount to the number of leads. Take the conversion rates from the illustrative example above and a plan of €60,000 a month with an average deal of €2,500.
- Payments: 60,000 ÷ 2,500 = 24 deals.
- Invoices: 24 ÷ 0.89 ≈ 27.
- Proposals: 27 ÷ 0.5 = 54.
- Qualified: 54 ÷ 0.6 = 90.
- Leads: 90 ÷ 0.45 = 200.
Then one question: do you get 200 leads a month? If you get 140, a €60,000 plan at these conversion rates will not be met however hard the team tries. There are three options: lower the plan to about €42,000, find another 60 leads, or raise conversion at the weakest transition. In the illustrative example that is the step from proposal to invoice: 60% instead of 50% gives the same 24 payments from about 167 leads.
Two refinements. The first is the lag: this month's payments grew out of leads that came in one sales cycle earlier, so the 200 leads have to arrive one cycle before the plan month. The second is the buffer. Norwest asked how much pipeline coverage companies plan for against the target: 48% of respondents said about three times the plan, 31% four times. The conversion chain answers the same question with your own transitions instead of an average multiplier: in the example, the proposal stage should hold 54 deals worth €135,000, which is 2.25 times the plan.
If the average deal differs a lot between products, run the chain for each one separately: one large contract among twenty small ones skews the average.
Conversion on the owner's one screen
Lesson 12 of the course "CRM for the owner" reduces the owner's numbers to one screen with three metrics: deals and amounts by stage, stage-to-stage conversion, and deals with no movement. Next to each metric is an "if it gets worse, I do" column. For conversion it is filled in per transition. If conversion from lead to qualified drops, that means a talk with marketing about sources; from proposal to invoice, a review of ten lost proposals with the rep; from invoice to payment, a check on who reminds the customer to pay and when. A metric with an empty cell in that column comes off the screen.
Once a month the numbers on the screen are checked against accounting: ten closed deals against ten invoices. What the discrepancies mean is covered in the article on sales rep KPIs. The "Owner's one screen" template is in Google Sheets, with the "10 deals against 10 invoices" ritual on the second sheet.
Sources
- Uspacy, 2026. Knowledge base: Funnel conversion report: Number, Skipped, average time in stage, conversion from the previous stage and cumulative conversion; conversion can exceed 100%
- Pipedrive Knowledge Base, 2026. Insights reports: deal conversion: by default the Funnel conversion report takes deals created this year and closed as won or lost
- HubSpot Knowledge Base, 2026. Create custom funnel reports: stages from date-entered timestamps, date range filtered by event date rather than deal creation
- Norwest, 2025. B2B Sales & Marketing Benchmark Report: survey of 177 sales and marketing leaders at VC- and PE-backed B2B companies, stage conversion and pipeline coverage
- Ivristech, 2026. B2B Win Rate Benchmarks: published win rates from 21% to 47% use different denominators
- RevSure. Funnel Analysis for B2B: cohort versus calendar counting, your own history as the benchmark
- Systemno, 2026. Funnel conversion: stages, formulas and typical leaks in six niches (in Ukrainian)
Author: Andrew Maryasov, founder of Auspex. Auspex has implemented CRM since 2015: 1,500+ projects for 1,200+ companies; in Ukraine it works with Uspacy.