
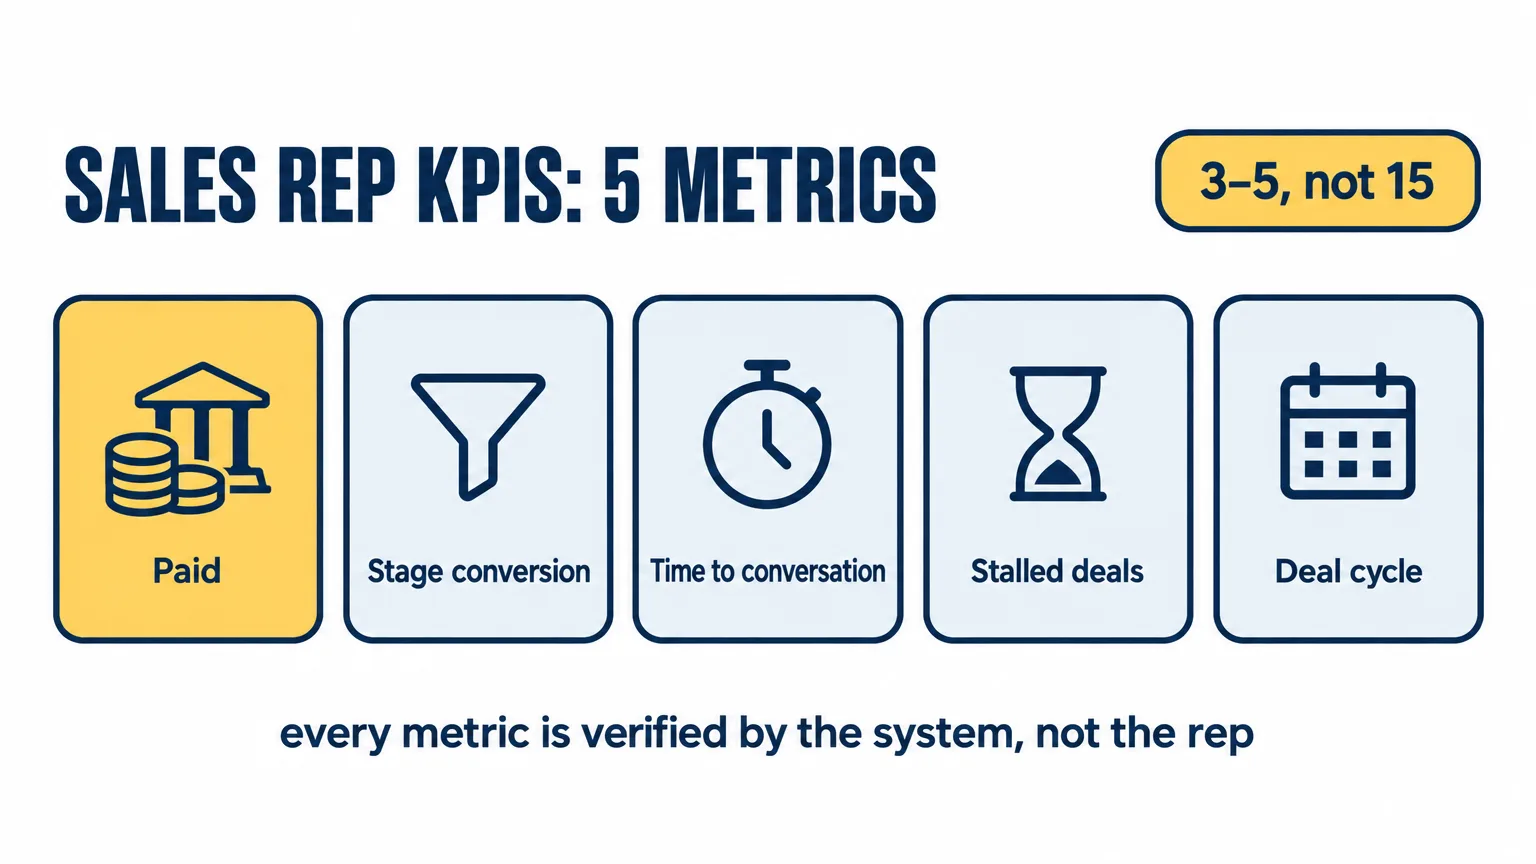
Two KPIs in one company: the one in the CRM and the one in accounting
When Auspex arrives for a CRM audit at a 10–200-employee company, the rep already has KPIs: a revenue plan, a number of calls, sometimes conversion. The list is rarely the problem. The problem is where the number comes from. If "paid" in the CRM is set by the rep on the customer's word, revenue is counted twice, by the CRM and by accounting, and the two do not match. If the rep counts their own calls, there are exactly as many as the bonus requires.
A metric the rep reports on themself works like a questionnaire: the answer is whatever people want to hear. Auspex covered how control without benefit produces a full CRM with groomed numbers in the article on the click test. This one is about something else: which metrics the system verifies on its own and how to build a bonus on them.
ORM Tech puts the same point from the analytics side: a team optimizes for what is measured, so if the KPI is calls per day, calls go up, and if the KPI is pipeline created, the rep thinks about the quality of the conversation. The root cause, in their words, is measurement design, not motivation. Hence the rule: a sales rep KPI is a number the system takes from a fact, not from a field the rep fills in by hand.
Five metrics the CRM calculates
Each metric below has a source in the system and someone who verifies it. Two of them, conversion and stalled deals, sit on the owner's screen from lesson 12 of the course "CRM for the owner", so the owner and the rep look at the same numbers.
- Paid in the period. Source: payments from accounting or the bank via integration instead of the "Paid" stage in the CRM. Verified by the accountant. Decision that rests on it: the plan and the bonus. When the rep sets "paid", the company ends up with two "paid" figures, and the bonus is calculated on whichever is more convenient to believe.
- Stage-to-stage conversion. Source: the pipeline report. It only works when every stage has an entry condition; otherwise the report compares the incomparable. Decision: where in the process the losses are and whom to coach. CrmAI gives B2B benchmarks: proposal to deal 20–40 percent, overall lead to deal 5–15; krupkin.pro calls a win rate of 20–30 percent the B2B norm. Those are their benchmarks, not a standard: your norm is your own median over six months.
- Time to the first live conversation. Source: the inquiry timestamp and the first activity in the card, median per week. Verified by the system. Decision: inquiry distribution and on-duty rota. Auto-replies do not count, or the metric turns green while conversations stay flat.
- Deals with no movement for more than N days. Source: a filter on the last activity date or on an empty next step. Verified by the system. Decision: close the deal or bring it back to work. For services N is 7–14 days, for long B2B deals up to 30; pick the number from your own median cycle.
- Cycle length: days from inquiry to payment. Source: creation date and payment date. Decision: cash forecast and workload planning. A cycle that grows two months in a row at the same conversion means deals are stalling at one stage, and the stage report shows which one.
The number of calls: a diagnostic, not a bonus
Calls, emails and meetings are the easiest to count, so they are the first to land in the bonus. CrmAI describes companies where reps "worked the numbers": formally a hundred calls a day, most of them twenty seconds long. Bridge Group, in its 2015 inside sales report as retold by Geckoboard, counted an average of 52 dials per rep per day and 6.7 meaningful conversations out of them. Seven conversations for fifty dials: paying for dials means paying for forty-five short ring tones.
Salesforce, in its 2024 State of Sales survey of 5,500 sales professionals, reports that selling itself takes 30 percent of the working week; the rest goes to data entry, quotes and lead routing. A "hundred calls" KPI adds a call report on top of those 70 percent.
Activity stays in the system, but as a diagnostic. If conversion dropped, the call report shows whether the rep talked to fewer customers or talked just as much while the conversations got worse. krupkin.pro's three-level model gives activity 10–20 percent of the weight and results 50–70. A simpler option for a 10–200-employee company: results and conversion in the bonus, activity on the screen with no money attached.
How many metrics and with what weight
Megaprojects recommends 3–5 metrics, Elma365 5–7 per level, and CrmAI recalls a company with 15 KPIs where reps ended up focusing on nothing. They agree on one thing: the list has to fit in the rep's head without a spreadsheet.
Weights. krupkin.pro: results 50–70 percent, process 20–30, activity 10–20. Elma365 shows a 50/30/20 example for revenue, conversion and repeat sales. For a company that sells against invoices a working scheme is: paid 60, proposal-to-payment conversion 25, response speed or stalled deals 15. No weight on calls and no metric the rep can fix themself. The fixed part of the salary stays: Elma365 explicitly warns against paying for KPIs alone.
A week on the data before money is tied to it
A bonus on a CRM number works if the number can be trusted. Lesson 12 of the course suggests a half-hour ritual: ten deals closed last month against ten invoices from accounting, matching amounts and dates. A row that does not match is not a reason to punish the rep but a reason to see where the process bypasses the CRM. If three out of ten do not match, a bonus on "paid" from the CRM is premature: first one source for payments, then the money.
The same goes for conversion. If stages have no entry conditions, a conversion bonus rewards shuffling deals between stages, and the report drifts even further from reality. The order is fixed: entry conditions, a week of data, then KPIs.
Template: five KPIs with a source and a check
The Google Sheet below (in Ukrainian) has two tabs. The first, "Five KPIs": metric, where it comes from in the CRM, who verifies it, which decision rests on it, bonus weight and this month's value; five rows are filled in, two are empty for your own, and the weights are checked by a formula. The second, "Source check": for each metric, the answer to "can the rep change the number themself" and what to do if yes. Filled in, the template becomes a task list for the CRM administrator: which fields the system sets, where payments come from, which filter shows stalled deals.
The same numbers for both
When the rep and the owner look at the same five numbers that neither of them can adjust by hand, the bonus conversation stops being an argument about who remembers what. The rep sees where they are losing before the owner does. If the CRM is already in place and KPIs are still counted in a spreadsheet from hearsay, Auspex sets up the sources and reports in a 2–3-day CRM audit together with the processes and the data.
Sources
- ORM Tech. Activity Metrics vs Outcome Metrics: teams optimize for what is measured; the root cause is measurement design, not motivation
- CrmAI, 2025. Sales rep KPIs: B2B conversion benchmarks according to CrmAI (proposal → deal 20–40 %, lead → deal 5–15 %), a hundred twenty-second calls, a company with 15 KPIs
- Geckoboard. Activity Per Rep: retelling the Bridge Group 2015 inside sales report, an average of 52 dials and 6.7 meaningful conversations per day
- Salesforce, 2024. State of Sales, sixth edition: according to their survey of 5,500 sales professionals, 30 % of the week is spent selling
- krupkin.pro. KPIs for sales reps: model according to krupkin.pro: results 50–70 % / process 20–30 % / activity 10–20 %, win rate 20–30 % as the B2B norm
- Megaprojects. KPIs for a sales rep: 3–5 metrics
- Elma365, 2025. KPIs in sales: 5–7 metrics per level, 50/30/20 weight example, do not pay for KPIs alone
Author: Andrew Maryasov, founder of Auspex. Auspex has implemented CRM since 2015: 1,500+ projects for 1,200+ companies; in Ukraine it works with Uspacy.